Last year I had the honor of being selected by the DX Lab of the State Library of New South Wales (SLNSW) for their 2019 Fellowship. The fellowship asked proponents for a project idea that would require about eight weeks of work on site in Sydney, Australia, where SLNSW is located. I had never been to Australia before so I flew in early February of 2020, anticipating what I imagined would be two months of work and then a couple of weeks of regional travel. These plans were sidetracked by the Covid-19 pandemic and I was forced to leave Sydney in mid March and complete the project back home in Brooklyn. The project would eventually be called Aereo, which is the spanish word for “aerial”. The text below was originally published in the DX Lab blog and I plan on writing another post detailing a bit of the process behind the project. There is also a recording of the talk I did when the project was launched, in July of 2020, that goes through some of that process.
Aereo is an attempt at looking at library digital collections as a whole, rather than a list of discrete items or files in response to a keyword search. By displaying everything1 in a single interface there is hopefully more opportunity for a broad-based and serendipitous exploration of the collection.
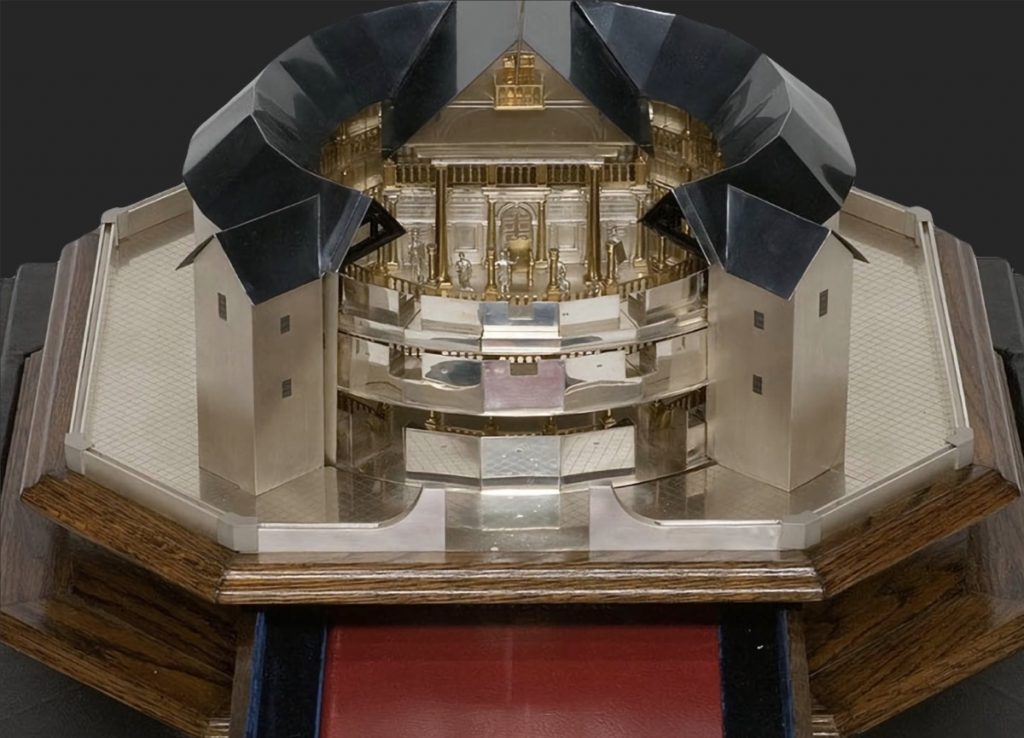
To the layperson, a library “item” can represent many different things: a collection of personal records, architectural drawings, photographs, and other documents from the construction of the Sydney Opera House; a group of sketches from that same collection; a photograph of a scale model during the construction phase of the project, in that same collection. Aereo is only concerned with the digital surrogates of these items: the files, photographs taken by library staff of these items. The categories and years for these files are inherited from the items they portray. An item might fall under multiple categories (e.g.: medals are also objects) and can also have multiple files, like this model of the Globe Theatre, London which can be seen from different angles and even has a drawer.
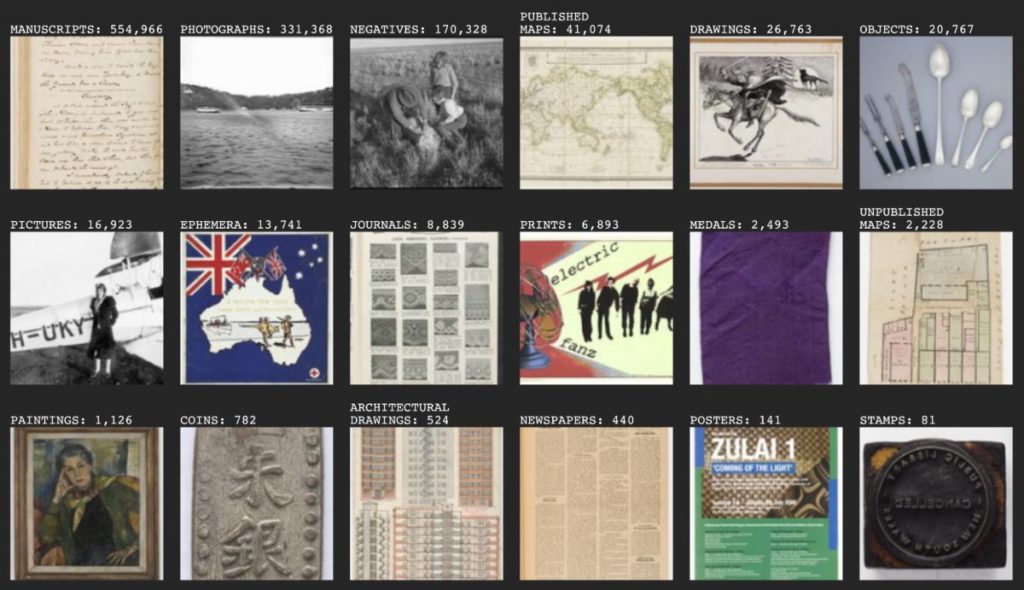
Not every item is (or will be) photographed by the Library to be published online. As of early February 2020, when this fellowship began and I received a bulk data set, the Library had provided access to over two million item files. I selected a subset of 18 categories (or “formats” in library parlance) to work with: architectural drawings, newspapers, coins, drawings, ephemera, journals, manuscripts, unpublished maps, published maps, medals, negatives, objects, paintings, photographs, pictures, posters, prints, and stamps. These categories comprise about 1.2 million files which were then analysed with different algorithms to produce Aereo. This selection left out, for example, books (some interesting book covers but mostly text and remember that each image of each page of every book would be present in Aereo and we’re talking of about 1.5 million books here so… skipped this one), audio and music (although it would be interesting to explore an interface that would combine both audio and images). If you look at the formats available currently in the Library website you will notice only 11 and I have just mentioned 21. That is because I had access to a bit more granular data about the items. That granular data about the format of some items is not available. Today’s cataloguing standards, including detailed format information, are much higher than they would have been in the past. You will probably see things that seem odd and that is to be expected. For any questions regarding the categorization, you can ask a librarian.
Sorting and machine learning
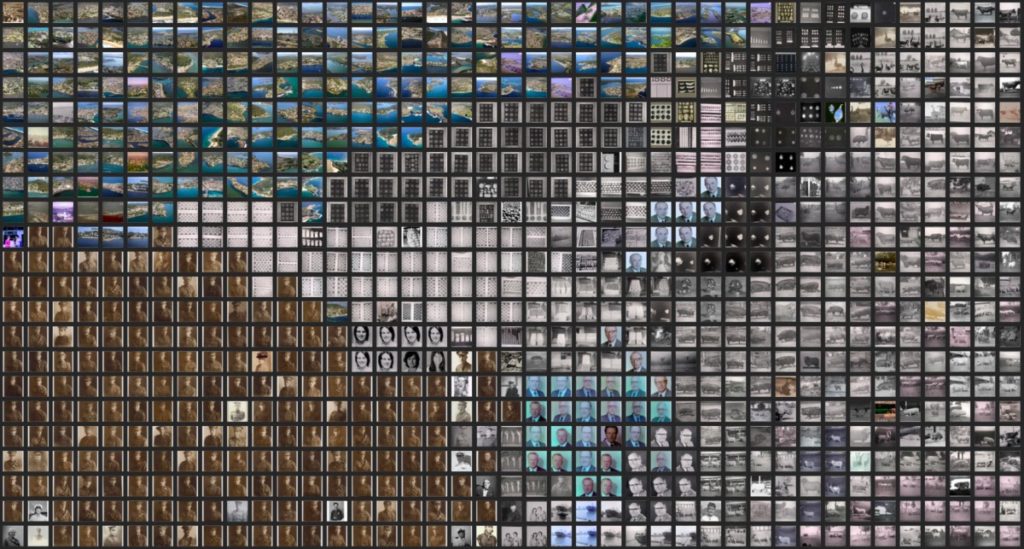
Aereo comprises about 1.2 million files in 18 different categories that can each be organised in four ways: unsorted, year, colour, and “look-alike”.
1. Unsorted
Pretty self-explanatory, except that it isn’t really “unsorted”. This sorting is just the default way the files were returned by a query made to the Library database. It is kind of like doing an empty search on a given category and receiving results sorted by “relevance”. This relevance is simply a measure of different weights given to different parts of the metadata of items and ranking them by the score they get. For example, the title of an item could be weighted higher than its author or format, so an item with the title “May Gibbs” and format “photograph” could appear before an item with the title “Illustration for Snugglepot and Cuddlepie” and author “May Gibbs”. As you can imagine, fine-tuning these weights is a difficult process and can be counterbalanced by the presence of other sorting criteria. The most common being alphabetical (by author or title) and…
2. Year
Dates are another common criteria for search interface sorting, that is, when items do have a date associated with them. In the Library data set an item can have multiple dates or none at all. For the purpose of this project I chose to work with what the data set calls published.date_creation and archive.date_production as items have either one or the other and it corresponds to what their name implies. These dates are sometimes also represented as a range (e.g. 28 July 1914 to 11 November 1918) so I selected the year of the lower bound of any range I found (e.g. 1914). In the case of no date found it will be zero and not displayed.
3. Colour
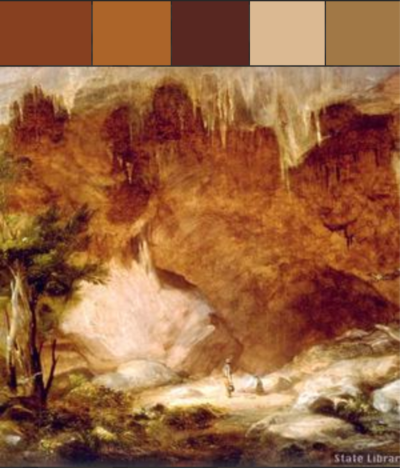
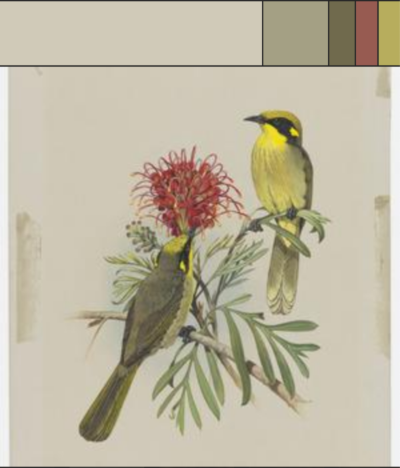
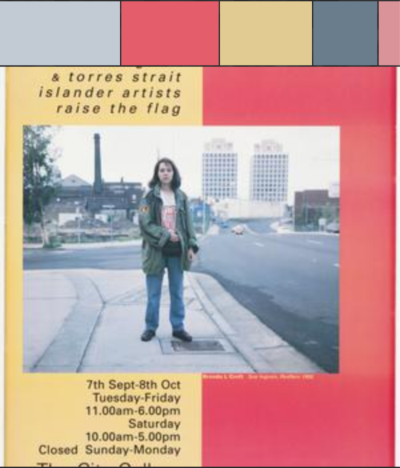
I wanted to provide new ways of sorting and looking at the items, beyond what already existed in the data set. I processed all 2 million images through a colour summarizer that extracts the most prominent colours from an image as well as other information such as its histogram. This information is displayed above the selected image as coloured boxes, the size of which is proportional to the amount of that colour in the image:
As a bonus, clicking on a colour will copy its hexadecimal red, green, blue value (e.g. “#FF0000” for red) to the clipboard.
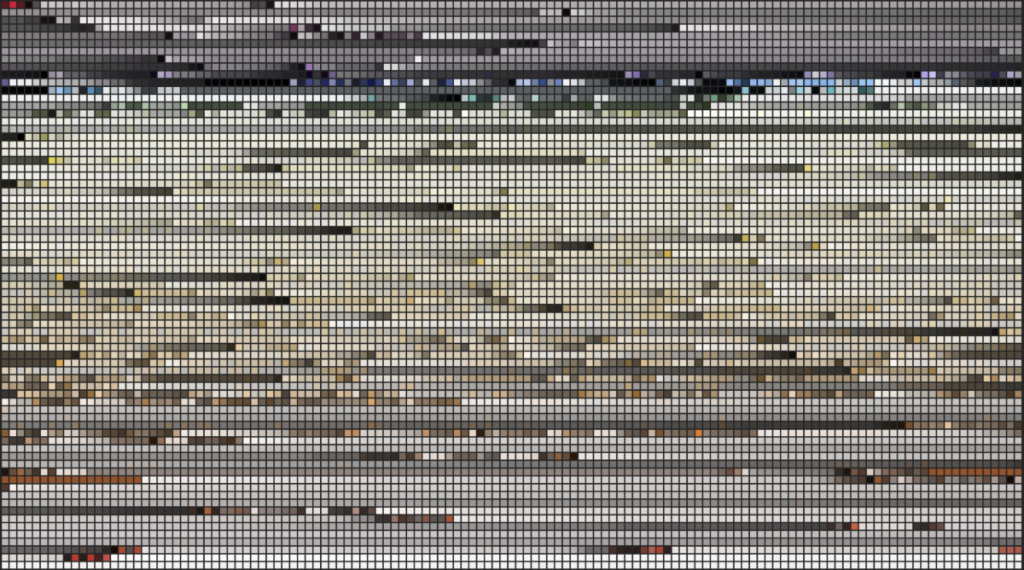
Sorting by colour is hard, especially when we’re talking about 500 thousand images as is the case for manuscripts. For simplicity, I’m choosing the first colour, which is the most prominent from the list of five and sorting by hue, then saturation and, finally, lightness. Colour sorting is better viewed when image thumbnails are not visible:
4. “Look alike”
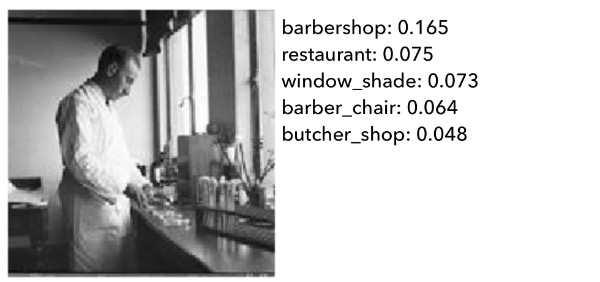
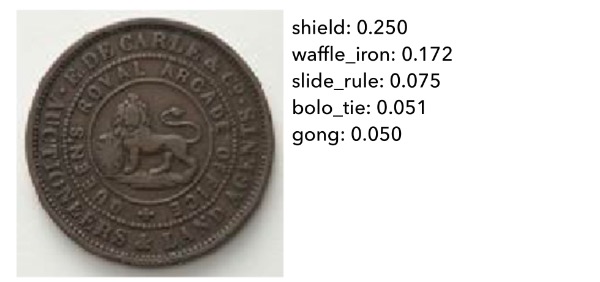
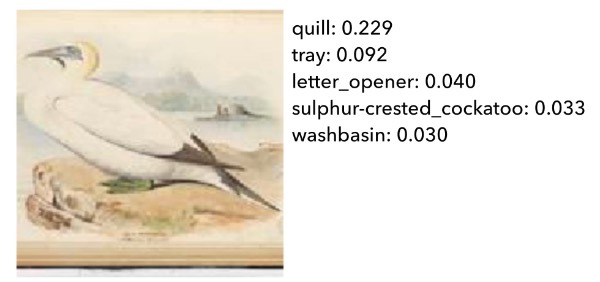
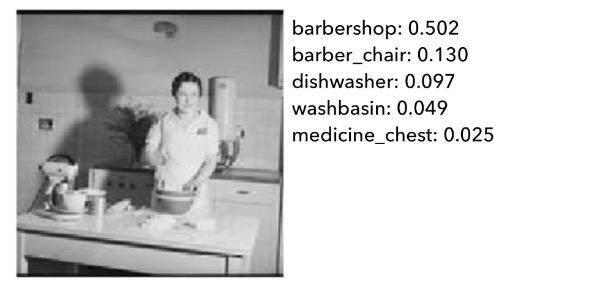
The Library has done some great work using machine learning to automatically create descriptive keywords for item files called TIGER. A similar process is used for the “look-alike” sorting in Aereo but, while TIGER aims to provide a description of an individual file, I use it to determine how similar images are to each other. The process basically provides a score between 0 and 1 for 4,096 words for every one of the 2 million images. This score represents how confident the algorithm is on a given word being present in an image: 0 being total certainty it is not present and 1 being total certainty it is present. Since there will always be some level of uncertainty, zeroes or ones will rarely come up, and more often values in between will be returned:
Machine learning algorithms are only as good as their training data: somebody has previously classified by hand as many images as possible with a set of words or labels, and the algorithm “learns” what, for example, a photo with a cat or a dog “looks like”. These algorithms and training sets are hard to produce so there aren’t many available and companies that have proprietary versions charge a lot of money for their use.
Fortunately, there are open source data sets, one of which, called Imagenet is in use in Aereo. Imagenet is trained on contemporary images, so it is “looking” for things like “food processor”, “vacuum cleaner”, or “Frisbee”, which may not be present in a collection that spans hundreds of years to the past and, conversely, contains images for words not present in the Imagenet vocabulary. While these words won’t be useful to describe the images themselves, it can be useful to find images that look similar to the algorithm.
The algorithm will make mistakes, classifying an image as, for example, a Frisbee, but it will make similar mistakes for images that look similar (other images that look like Frisbees to the algorithm). Notice how, in the two black and white images above, the algorithm has mistakenly classified them as “barbershop” and “barber chair” but the images do look similar: black and white, a person in a white outfit standing holding something, indoors in a relatively aseptic environment. The complete process of converting these values into a similarity score will be described in a separate post but you can see it in action (remember to activate thumbnails).
It’s all yours!
Aereo is only an interface to a bunch of data that I have produced with the help of the awesome DX-Lab and web teams of the State Library of New South Wales and all of it is available for you to download and do whatever you want to do with it. Processing and classifying two million images was no small task, and you don’t have to!
Code repositories
- Code repository for Aereo interface
- Code repository for image colour and similarity processing
- Code repository for thumbnail processing for Aereo
Data and files
| Name | File count2 | Size |
|---|---|---|
| File ID to URL mapping for categories/full set (CSV) | 22 | 48.1 MB |
| Colour summarizing (full version) | 2,212,318 | 64.3 GB |
| Colour summarizing (compact version) | 2,231,480 | 1.3 GB |
| Image predictions (4,096 word values, gzipped) | 2,231,222 | 33.8 GB |
| Image similarity intermediate data | 81 | 2.9 GB |
| Image thumbnails (150×150 pixels) | 2,231,496 | 9.8 GB |
| Image thumbnails (32×32 pixels) | 2,238,557 | 3.5 GB |
Thanks!
Thanks to the State Library of New South Wales, State Librarian Dr John Vallance and Mitchell Librarian and Director, Engagement Richard Neville, and especially to the DX Lab team: Paula Bray, Kaho Cheung, and Luke Dearnley, for their support during this project. Thanks also to Jenna Bain and Robertus Johansyah in the Digital Channels team, and all the Library staff who were immensely helpful and patient.
I also want to thank folks at the open-source community who helped me out in this project: Douglas Duhaime at the Yale DH Lab, Mario Klingemann, Kyle McDonald, Cyril Diagne, Gene Kogan, Ricardo Cabello.
- “everything” is a complicated word in library land and will be addressed in a future post but for now let’s say it means everything that was digitised at the Library by early February 2020 and was classified in the selected categories. ↩
- The discrepancy in file counts is due to some images being unable to be processed on any given step. Some files may also be empty. ↩
